Global summary
This module presents a dashboard of all flights in the logbook.
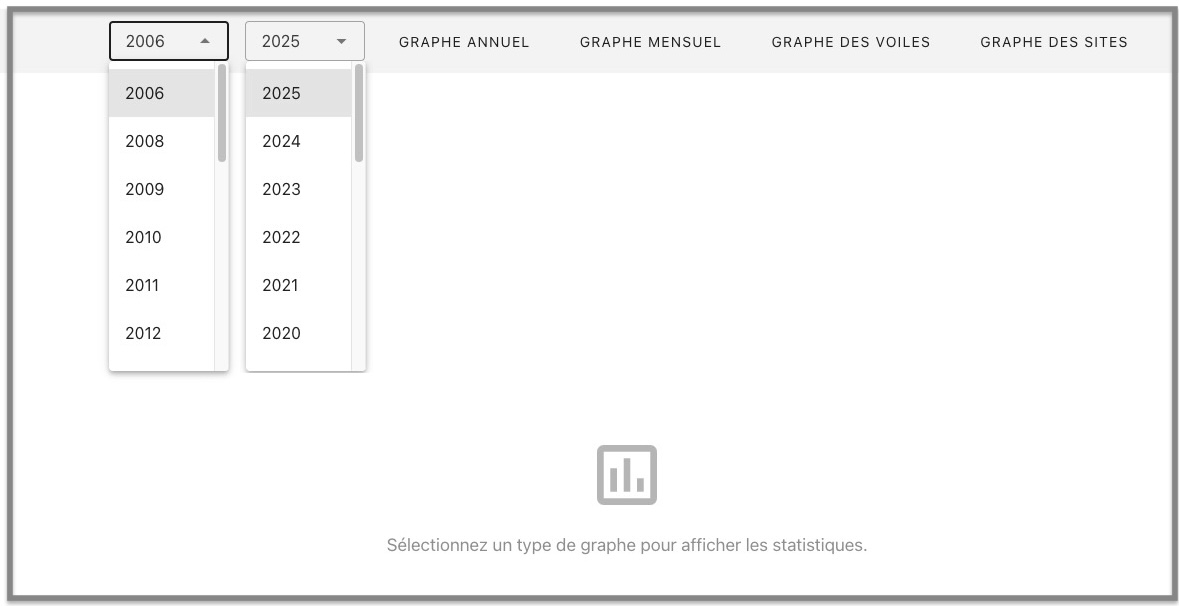
By default, the start year is the earliest year in the logbook, and the end year is the most recent year. You can modify these bounds by acting on the two dropdown lists. The list for the start year is ordered chronologically, while the list for the end year is ordered reverse-chronologically.
Choose the type of graph to display in the horizontal band above.
Summary for the period
Regardless of the type of graph selected, the lower section will display a summary of the key data for the period in question:

- Number of years
- Number of hours, number of flights
- Average annual hours and number of flights
- Number of sails and sites used over the period
Yearly chart
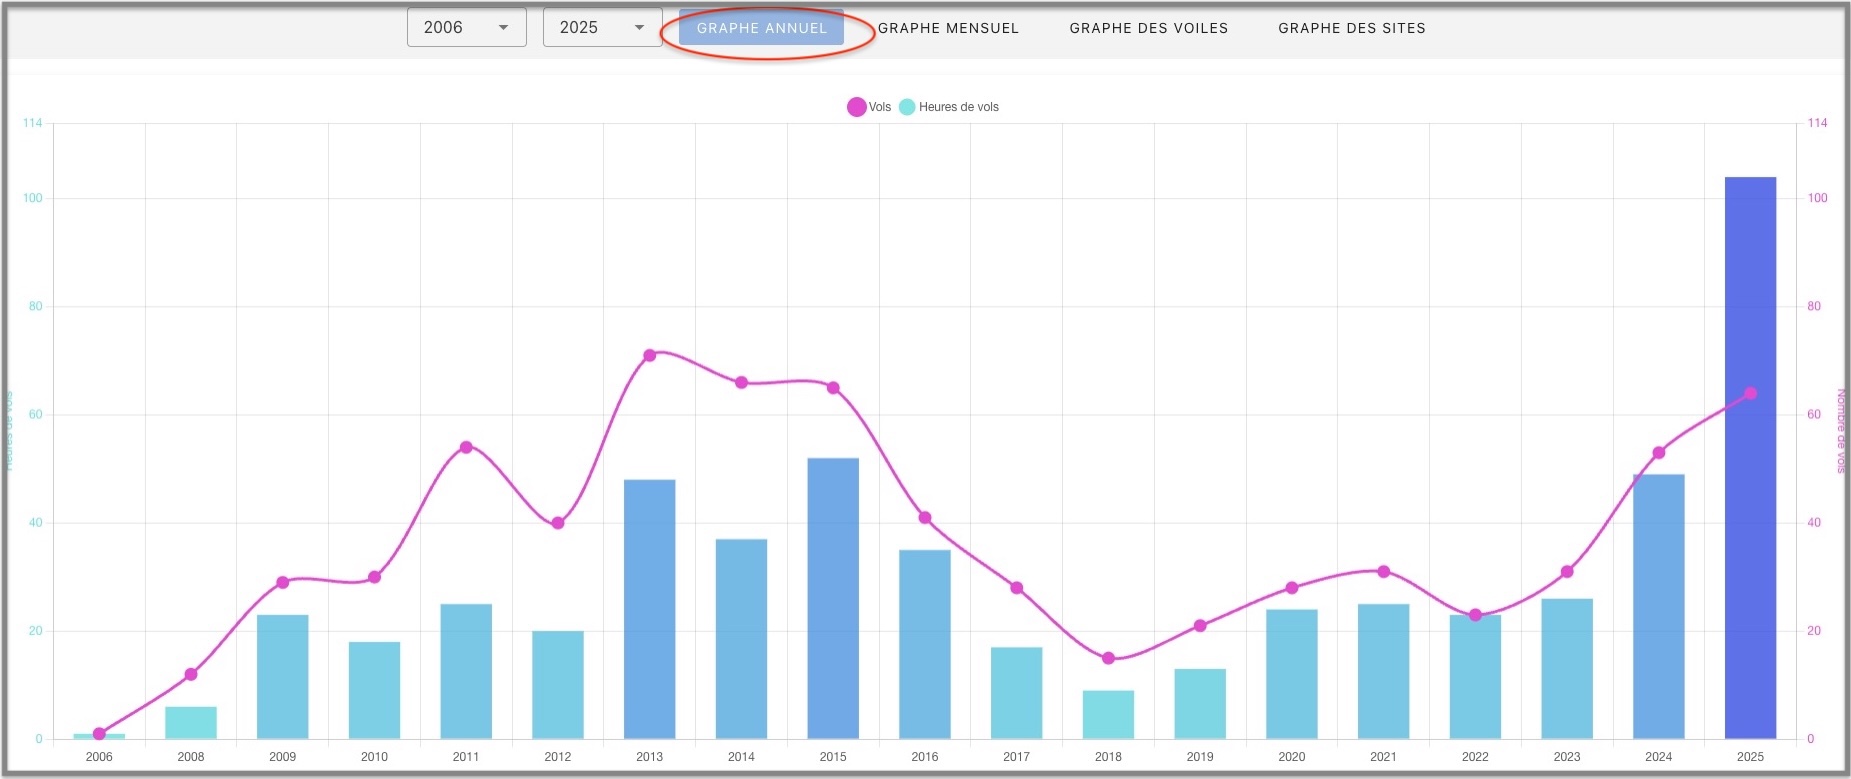
This graph displays an histogram of flight hours per year with a superimposed curve representing the number of flights per year.
Monthly chart
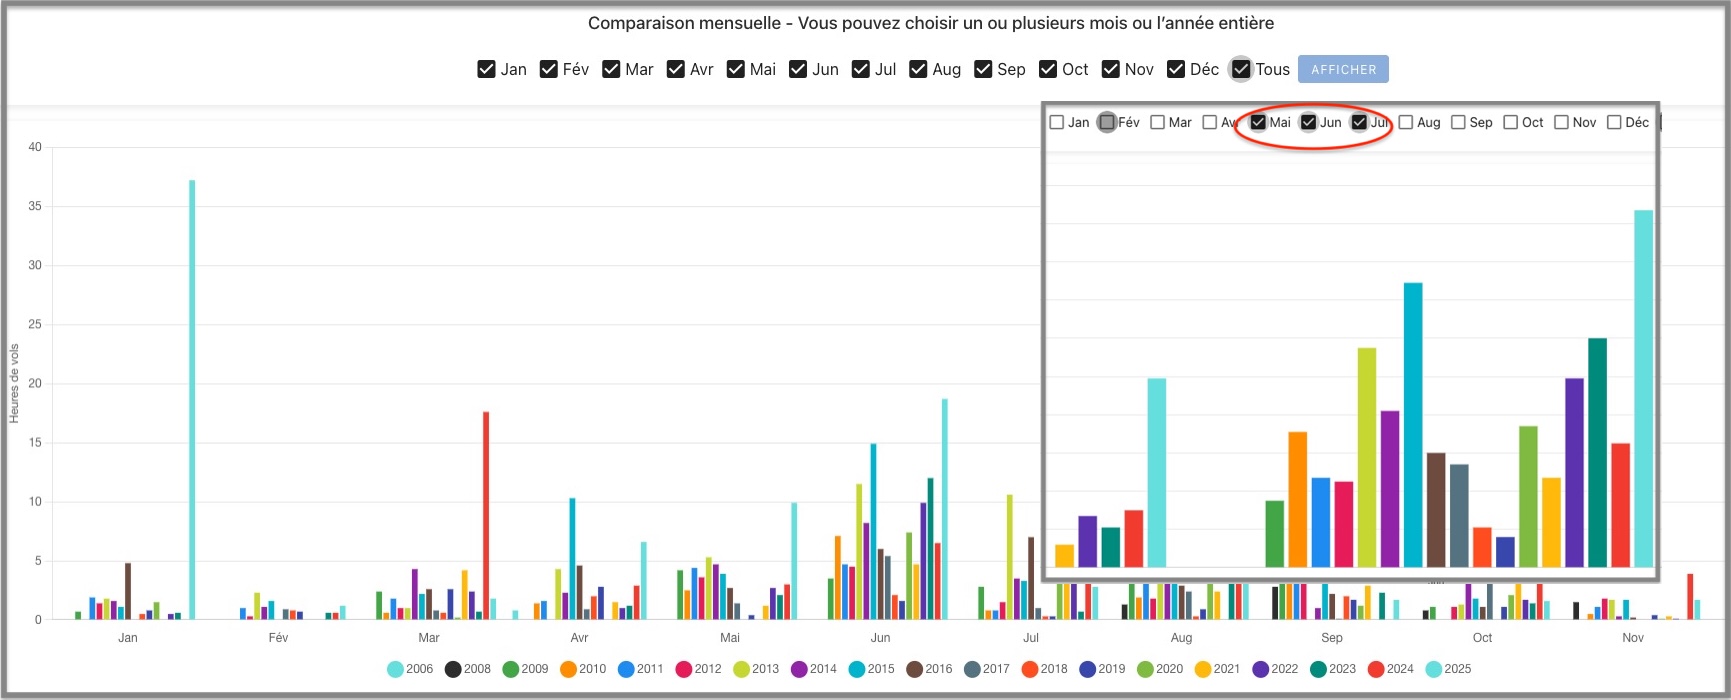
Compare months either by choosing all 12 months or selecting specific months by checking them.
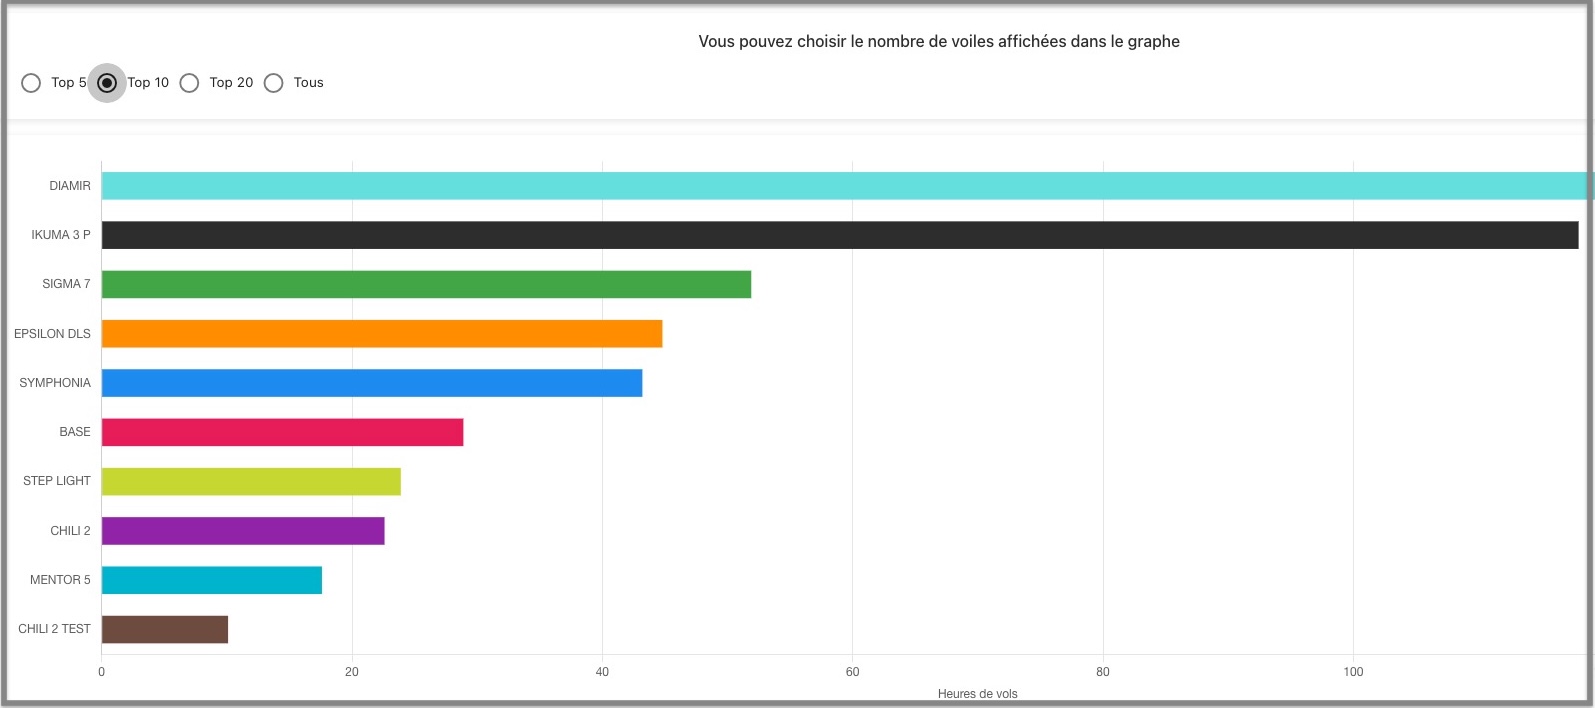
Gliders chart
Select the most used gliders and click Show
Sites chart
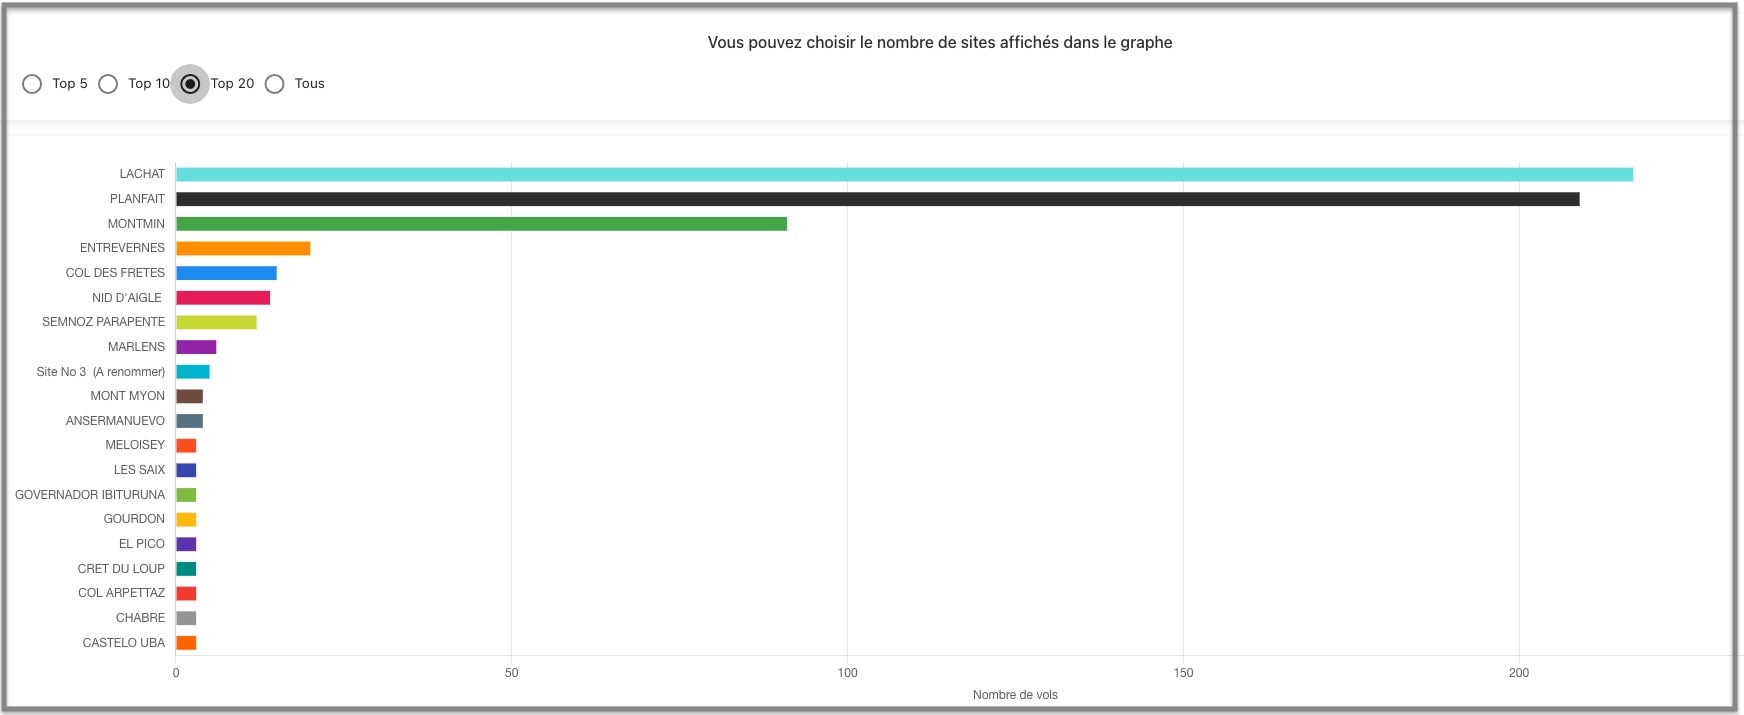
Select the most visited take-off sites and click Show