Analysis
Accessible directly from the notebook or via the Infos button from the detailed map
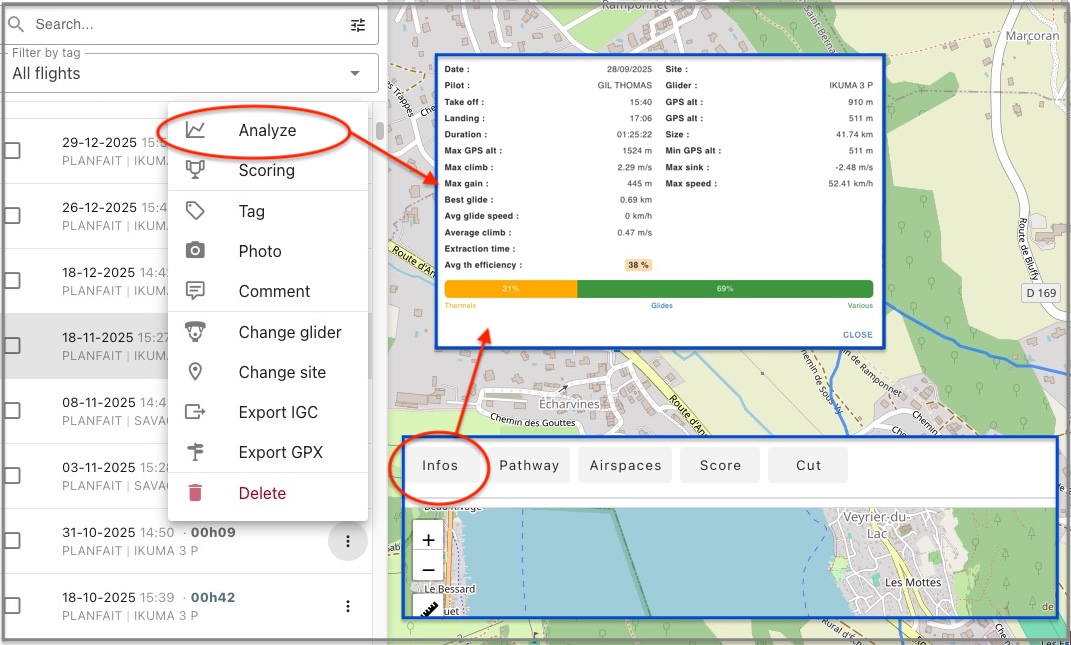
The maximum and minimum values for ground speed and Vz are smoothed over a 10-second period (5 seconds on either side of the point in question). This is the standard practice among instrument developers. Why 10 seconds?
- Noise filtering: This is sufficient to eliminate GPS positioning inaccuracies.
- Flight dynamics: A full 360° turn in paragliding takes around 15 to 25 seconds. Smoothing over 10 seconds allows the variation in speed during the turn to be tracked without overly ‘flattening’ the actual trajectory.
- Top speed: This allows a genuine maximum speed to be validated rather than an anomalous peak caused by poor satellite reception.
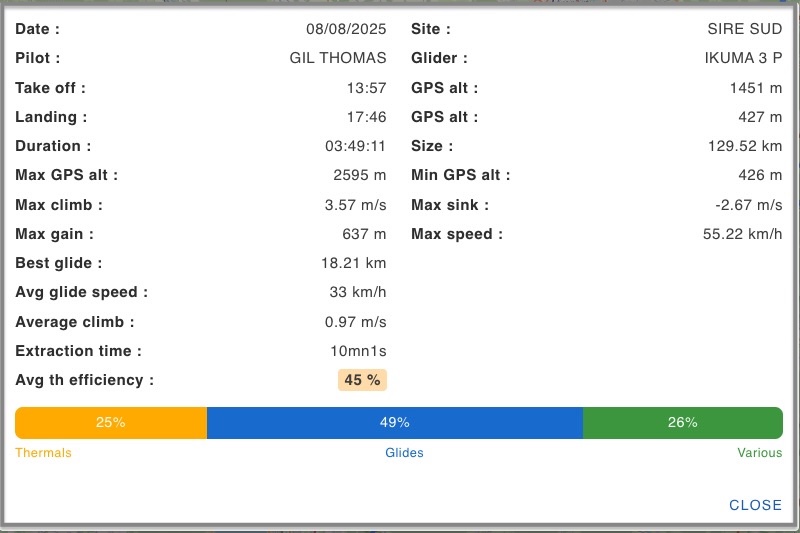
As for the progression, the code is a port of an original code by Tom Payne igc2kmz published on his Github repository.
From the project's algorithms page (which unfortunately disappeared for now), he described the calculation methods. Here are some excerpts:
For identifying thermals and transitions, a simple but effective heuristic method is used. The average climb rate over 20 seconds is compared to the pilot's progression. Progression is defined as the distance traveled along the track divided by the change in position over the same period. For example, in straight-line flight, the progression is close to 1, but if the pilot is turning around, the progression drops to almost zero: the pilot travels a long distance along the road without covering much ground. Experimental studies suggest that progression values above 0.9 correspond to glider behavior and values below this threshold correspond to a thermal evolution or descent in 360, even with strong wind.
With this method, the track is analyzed as follows:
- progression index > 0.9 → transition
- progression index < 0.9 and climb rate > 0 → thermal evolution
- progression index < 0.9 and climb rate < 0 → descent in 360
Naturally, it's essential to ensure that the calculated values are of interest to the pilot: long enough transitions, significant altitude gain in thermals, etc...
The thermal efficiency expressed as a percentage is the average climb rate divided by the maximum climb rate. A thermal efficiency of 100% corresponds to flying directly into the strongest core and remaining there until the end of the thermal. Lower values correspond to reduced time spent in the core or complete loss of the thermal at times. This simple model assumes that the maximum climb rate is achievable from start to finish of the thermal, which rarely occurs.
In practice, thermal efficiencies above 80% are rare, 70% or more is very good. Any level below 50% indicates non-homogeneous thermals.